
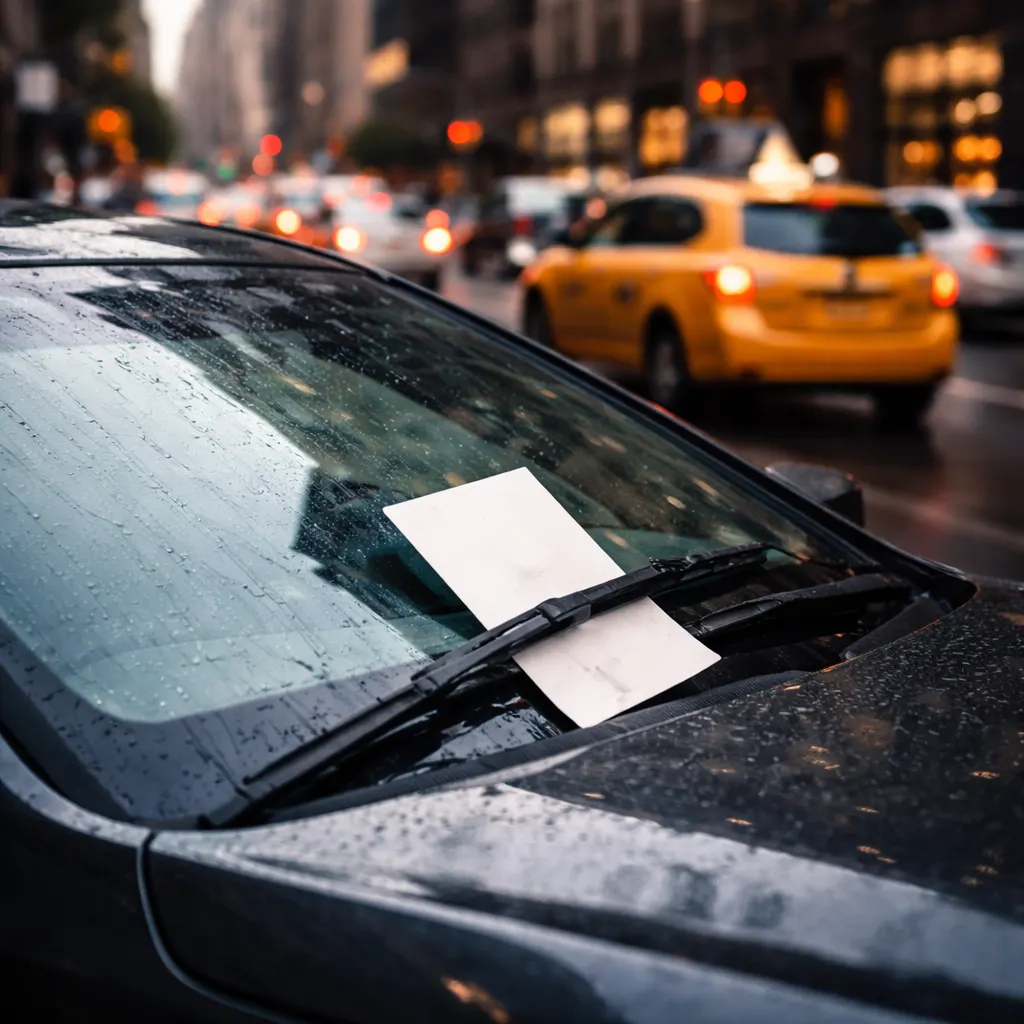
New York collected $123.30 in traffic fines per licensed driver in 2022, far more than any other state in the country, according to a new analysis by Grigor Law. The figure put New York at the very top of the national ranking, roughly 3.5 times the $35.16 national average. The analysis measured the per-driver burden by dividing total 2022 traffic fine revenue by the number of licensed drivers in each state.
New York's $123.30 per driver was about 1.55 times the amount collected in second-place Illinois, which came in at $79.74, and roughly 4.5 times higher than neighboring New Jersey at $27.59. Connecticut sat at just $3.46 per driver, about 35.6 times lower than New York. Despite holding just 5.2% of the country's licensed drivers, New York alone accounted for 18.1% of all traffic fine dollars collected nationwide, the single largest share of any state. Texas followed in third place at $53.31 per driver, and Georgia came in fourth at $52.86, both far below New York even though Texas carried more licensed drivers. New York's figure towered over every regional benchmark, sitting about 2.4 times the Northeast region average of $51.36, which was the highest of the four US regions. The South, Midwest, and West all ranged between $29.85 and $32.98, well below what New York collected.
"These figures show how heavily the per-driver burden of traffic fines fell on New York in 2022," Chrissy Grigoropoulos, founder of Grigor Law Injury and Car Accident Lawyers, said in the report. At $123.30 per licensed driver, the state sat far above the $35.16 national average, and the analysis notes that New York drivers benefit from understanding how their state compares in a given year. The figures represent state averages across all licensed drivers and don't reflect the amount paid by any single driver, the report clarifies.
The concentration of traffic fine revenue in New York reveals how unevenly the burden falls across the country. While the report doesn't explicitly identify causes, the sheer gap between New York and other large states with similar driver populations points to differences in enforcement practices, fine structures, or violation rates. The analysis used data from the Federal Highway Administration for licensed driver counts and the Reason Foundation Fines and Fees project for fine revenue figures, covering the 2022 calendar year. The per-driver calculation offers a way to compare states of different sizes on equal footing, making New York's position at the top all the more striking given that larger states like California and Texas collected far less per driver despite having more people on the road.